
If you’re searching for a clear, practical guide to Fibonacci retracement entries, you’re likely looking for more precise trade timing and better risk control. Many traders understand the concept of Fibonacci levels, but struggle to translate them into structured, repeatable entry strategies that align with real market momentum.
This article is designed to close that gap. We break down how Fibonacci retracement entries work in trending and corrective markets, how to combine them with momentum confirmation, and how to avoid the common mistakes that lead to premature or late entries. You’ll learn when retracement levels matter, when they fail, and how to integrate them into a disciplined risk management framework.
Our insights are grounded in tested trading principles, technical analysis research, and real-world market behavior across multiple asset classes. By the end, you’ll have a clearer, rules-based approach to identifying high-probability setups using Fibonacci retracement levels with confidence.
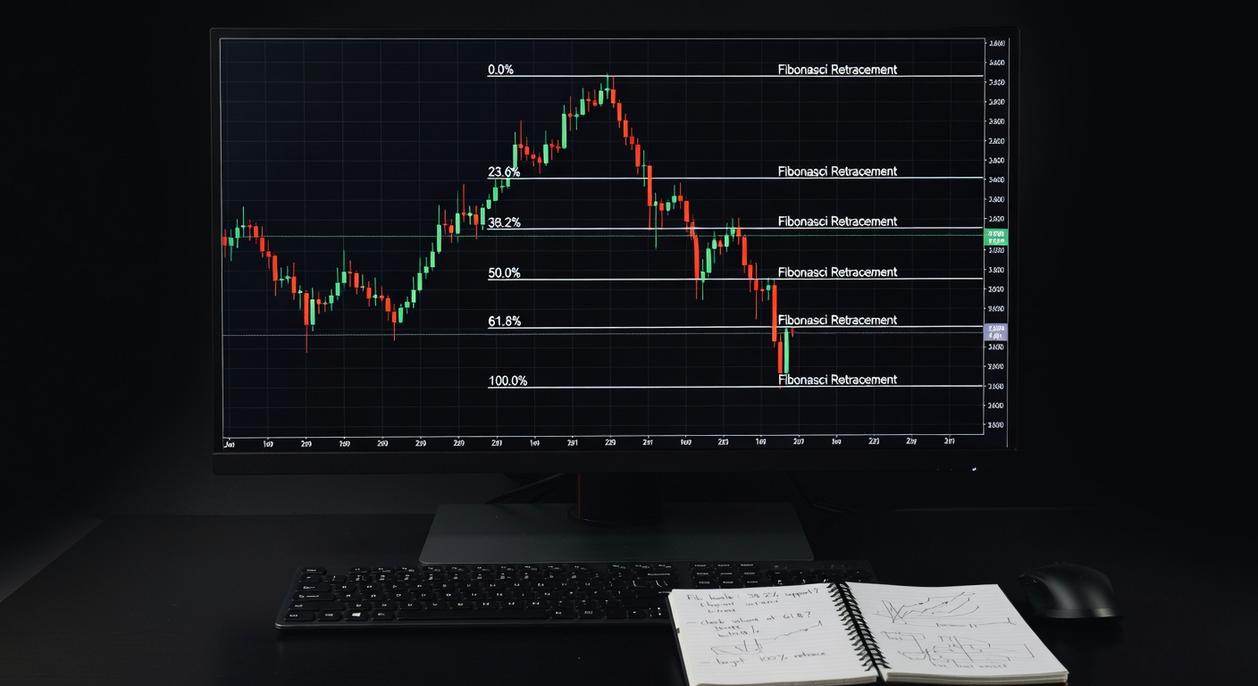
Timing a trade is hard. Enter too early, momentum stalls. Enter too late, profits shrink. Fibonacci retracement offers structure by mapping potential reversal zones based on key ratios like 38.2%, 50%, and 61.8%—levels derived from a mathematical sequence observed in nature and markets (Investopedia).
Critics argue these levels are self-fulfilling or arbitrary. Fair point. Price doesn’t reverse because of magic numbers. It reacts because traders watch them. That shared focus creates liquidity clusters.
To apply Fibonacci retracement entries effectively:
- Identify a swing high and low.
- Draw levels across impulse move.
- Wait for confirmation via volume or candlesticks.
The Foundation: What Are Fibonacci Levels and Why Do They Work?
The Mathematical Origin
The Fibonacci sequence—where each number equals the sum of the two before it (1, 1, 2, 3, 5, 8, 13…)—produces ratios that converge toward 1.618, known as the Golden Ratio. This proportion appears in nature (spiral galaxies, sunflower seeds) and, interestingly, in financial markets. Studies in technical analysis journals have shown recurring price reactions near these ratios, suggesting markets often retrace in mathematically proportional waves rather than random fractions.
Defining the Key Ratios
The primary retracement levels are 23.6%, 38.2%, 50%, 61.8%, and 78.6%. In practice, 23.6% signals a shallow pullback, often seen in strong trends. Meanwhile, 38.2% and 61.8% are the most statistically observed correction zones in trending equities and forex markets (CFI, 2023). Although 50% is not a true Fibonacci ratio, Dow Theory historically observed that markets frequently retrace half a move before continuing. Finally, 78.6% represents a deep correction—often the last defense before a trend reversal.
The Psychology of Self-Fulfilling Prophecy
Admittedly, critics argue these are just “magic numbers.” However, trading volume data frequently clusters around Fibonacci retracement entries, reinforcing them as real support and resistance zones. Because institutions and algorithms monitor these levels, order flow increases there—turning expectation into reaction.
In other words, these levels quantify how far a market corrects before resuming its primary trend (not mystical—measurable). Pro tip: combine them with volume analysis for stronger confirmation.
Practical Application: A Step-by-Step Guide to Drawing Fibonacci Levels
Most trading platforms—TradingView, MetaTrader, ThinkorSwim—include a built-in Fibonacci retracement tool. Use it. Don’t eyeball levels (that’s how “close enough” turns into “why did I enter there?”).
1. Plotting Levels in an Uptrend
In an uptrend, identify a clear Swing Low (a significant price bottom before a strong upward move) and a Swing High (the peak before price pulls back).
Draw from the Swing Low up to the Swing High.
This anchors the retracement grid to the dominant move, helping you spot potential pullback zones like 38.2%, 50%, or 61.8%. These are common areas for Fibonacci retracement entries when momentum resumes.
2. Plotting Levels in a Downtrend
Reverse the logic.
- Identify a strong Swing High.
- Locate the subsequent Swing Low.
- Draw from the high down to the low.
This highlights potential resistance during a bounce.
Common Mistakes to Avoid
- Drawing from minor wicks instead of meaningful swing points.
- Forcing Fibonacci onto sideways, range-bound markets.
- Ignoring confluence with structure or volume.
Recommendation: Only apply Fibonacci after a clear impulsive move. If the market looks flat, step back. For systematic confirmation, study algorithmic trading signals how quant models generate alerts to align entries with quantified momentum.
Strategy Execution: Identifying High-Probability Entry Points
Timing matters. Even the strongest trend can punish poor entries (ask anyone who’s chased a breakout five minutes too late). That’s why precision around Fibonacci retracement entries can dramatically improve risk-to-reward profiles.
Focus on the Golden Pocket
First, let’s define the Golden Pocket: the price zone between the 61.8% and 66% retracement levels. The 61.8% level comes from the Fibonacci sequence, a mathematical pattern found throughout nature and financial markets. Traders watch this zone because it often marks exhaustion in a pullback before the dominant trend resumes.
For example, in a strong uptrend, price may retrace into this pocket, stall, and then surge higher. This zone frequently offers tighter stop placement and stronger upside continuation—benefits that directly improve trade efficiency.
The Power of Confluence
However, Fibonacci alone isn’t magic. Its real strength appears with confluence, meaning multiple signals align at the same level. Imagine a 50% retracement lining up with a 200-day moving average and a prior support zone. That layered agreement increases the probability of a bounce.
Some critics argue Fibonacci is self-fulfilling. Fair point. But when institutional tools like moving averages and historical structure align, probability—not belief—drives decisions.
Waiting for Confirmation
Equally important, don’t enter just because price “touches” a level. Wait for confirmation, such as a bullish engulfing candle or hammer pattern. These formations signal buyer commitment, reducing false entries.
Shallow vs. Deep Pullbacks
Finally, context matters. A shallow 38.2% retracement suggests strong momentum. In contrast, a 78.6% pullback may indicate weakening trend strength. The depth of the retracement helps traders gauge conviction before committing capital.
RISK MANAGEMENT turns Fibonacci setups from hopeful guesses into structured trades. Here is how to control exposure while maximizing upside:
-
SET AN INTELLIGENT STOP-LOSS. In an uptrend, place your stop just below the swing low that anchors your Fibonacci retracement entries. In a downtrend, position it just above the swing high. This rule-based placement protects capital if structure fails (price breaking structure is your exit signal).
-
DEFINE PROFIT TARGETS WITH EXTENSIONS. Use Fibonacci extension levels like 127.2% and 161.8% to project logical exits. These levels reflect common momentum expansion zones, giving you data-driven targets instead of emotional guesses.
-
CALCULATE RISK-TO-REWARD FIRST. Measure the distance to your stop and compare it to the distance to your extension target. Only take trades offering at least a 1:2 ratio.
Some traders argue fixed pip stops are simpler. Simpler, yes—but structure-based stops adapt to volatility, which improves consistency over time. That builds long-term discipline.
From theory to execution, Fibonacci retracement provides a logical roadmap for potential market turning points, reducing guesswork and anchoring decisions in measurable price structure. In other words, you’re reacting to probabilities, not predictions. However, it’s a tool—not a crystal ball. Markets trend, stall, and fake out (yes, even at the 61.8% level), which is why Fibonacci retracement entries must align with volume shifts, momentum divergence, and predefined risk limits. That integrated approach is where most traders fall short. So backtest relentlessly, journal results, and refine position sizing in a demo account before risking capital. Confidence comes from tested repetition alone.
Turn Market Levels Into Confident Trades
You came here to understand how to align market momentum, risk management, and precision timing into a structured trading approach. Now you have the framework to do exactly that.
When entries feel uncertain and volatility shakes your confidence, it’s rarely the market’s fault—it’s a lack of structure. Applying disciplined risk parameters, confirming momentum, and using Fibonacci retracement entries with intention helps eliminate emotional decisions and replace them with calculated execution.
The opportunity in front of you is simple: act on what you’ve learned. Build your trading plan around defined levels. Backtest your setups. Refine your position sizing. Execute with rules—not impulses.
If inconsistent results and second-guessing are holding you back, it’s time to change that. Join the thousands of traders who rely on proven signal analysis, structured planning, and disciplined risk frameworks to trade with clarity. Start implementing these strategies today and take control of your next move.
 Josephine Kieferonald is the kind of writer who genuinely cannot publish something without checking it twice. Maybe three times. They came to investment planning approaches through years of hands-on work rather than theory, which means the things they writes about — Investment Planning Approaches, Advanced Trading Signal Analysis, Market Momentum Watch, among other areas — are things they has actually tested, questioned, and revised opinions on more than once.
That shows in the work. Josephine's pieces tend to go a level deeper than most. Not in a way that becomes unreadable, but in a way that makes you realize you'd been missing something important. They has a habit of finding the detail that everybody else glosses over and making it the center of the story — which sounds simple, but takes a rare combination of curiosity and patience to pull off consistently. The writing never feels rushed. It feels like someone who sat with the subject long enough to actually understand it.
Outside of specific topics, what Josephine cares about most is whether the reader walks away with something useful. Not impressed. Not entertained. Useful. That's a harder bar to clear than it sounds, and they clears it more often than not — which is why readers tend to remember Josephine's articles long after they've forgotten the headline.
Josephine Kieferonald is the kind of writer who genuinely cannot publish something without checking it twice. Maybe three times. They came to investment planning approaches through years of hands-on work rather than theory, which means the things they writes about — Investment Planning Approaches, Advanced Trading Signal Analysis, Market Momentum Watch, among other areas — are things they has actually tested, questioned, and revised opinions on more than once.
That shows in the work. Josephine's pieces tend to go a level deeper than most. Not in a way that becomes unreadable, but in a way that makes you realize you'd been missing something important. They has a habit of finding the detail that everybody else glosses over and making it the center of the story — which sounds simple, but takes a rare combination of curiosity and patience to pull off consistently. The writing never feels rushed. It feels like someone who sat with the subject long enough to actually understand it.
Outside of specific topics, what Josephine cares about most is whether the reader walks away with something useful. Not impressed. Not entertained. Useful. That's a harder bar to clear than it sounds, and they clears it more often than not — which is why readers tend to remember Josephine's articles long after they've forgotten the headline.