Markets move fast—and if you’re here, you’re likely looking for clear, actionable insight to help you make smarter trading and investment decisions. Whether you’re analyzing momentum shifts, refining your risk management strategy, or evaluating new opportunities, this article is designed to give you practical guidance grounded in real market behavior.
We break down the core principles driving price action, from technical trading signals to broader macroeconomic indicators impact that influence volatility, liquidity, and investor sentiment. Instead of vague predictions, you’ll find structured analysis that connects financial theory with real-world application.
Our approach is rooted in disciplined market observation, data-backed analysis, and proven risk management frameworks. The goal is simple: help you understand what’s moving the market, why it matters, and how to position yourself strategically. By the end, you’ll have clearer insight into current conditions and a stronger foundation for confident, informed decision-making.
Decoding the Economy’s Language: Why Key Indicators Matter
The economy speaks in numbers. Macroeconomic indicators are the data points that reveal its health and direction. If you’ve ever wondered why markets jump after a jobs report, this is why.
Here’s a simple breakdown:
- GDP (Gross Domestic Product): The total value of goods and services produced. It measures economic growth.
- CPI (Consumer Price Index): Tracks inflation by monitoring price changes.
- Unemployment Rate: Shows how many people are actively seeking work.
Understanding macroeconomic indicators impact helps investors shift from reactive trades to proactive risk management. Isn’t it better to interpret signals than guess?
Gross Domestic Product (GDP): The Ultimate Economic Scorecard)
Gross Domestic Product (GDP) is the total monetary value of all final goods and services produced within a country’s borders during a specific period, typically quarterly or annually. Think of it as the economy’s report card—if production rises, the nation is earning its keep (and then some).
GDP is calculated using three primary methods:
- Production approach – measures total output across industries.
- Income approach – totals wages, profits, and taxes minus subsidies.
- Expenditure approach – adds consumer spending, investment, government spending, and net exports.
When GDP rises, businesses often scale operations, hire more workers, and report stronger earnings. That momentum tends to lift stock prices because investors anticipate higher profits. However, exceptionally rapid growth can spark inflation concerns. Central banks may respond with interest rate hikes to prevent overheating, which can temper market enthusiasm.
On the flip side, two consecutive quarters of negative GDP growth signal a recession. Reduced consumer spending and business contraction typically follow. Yet weaker data can sometimes boost markets if investors expect stimulus or rate cuts.
Understanding GDP’s macroeconomic indicators impact helps investors align portfolios with economic cycles—positioning for growth when expansion builds and protecting capital when contraction looms.
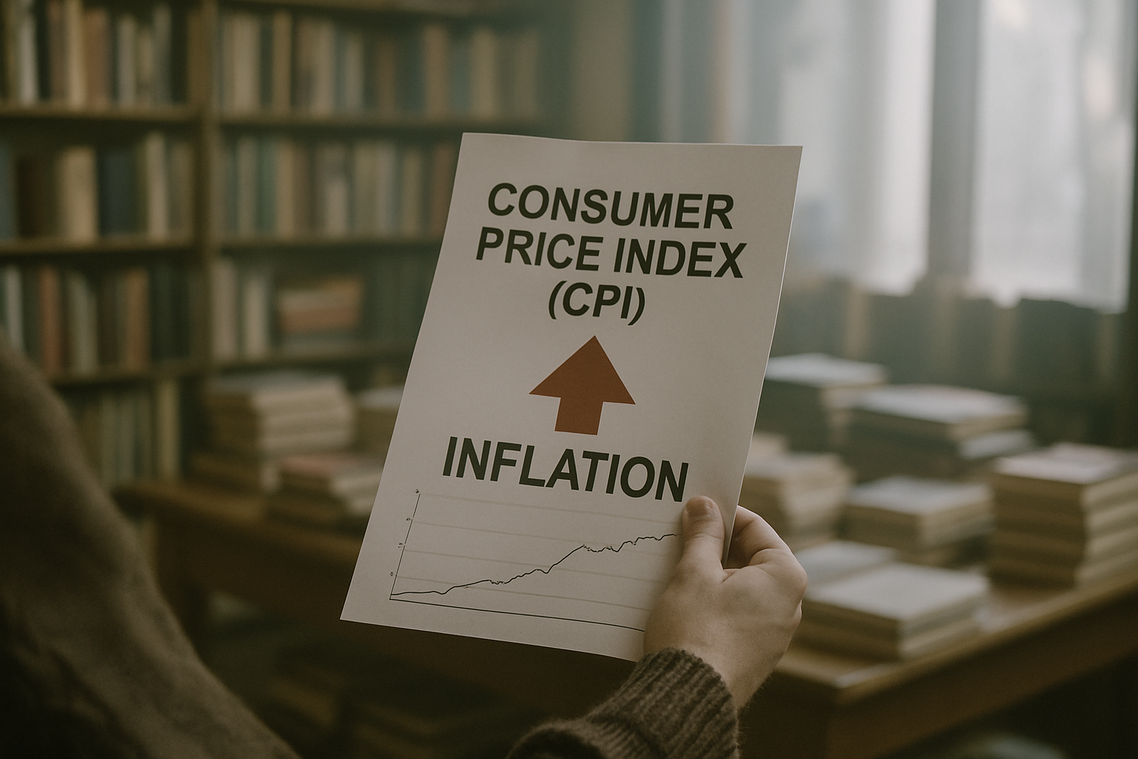
The Consumer Price Index (CPI) and Inflation: Gauging Your Purchasing Power
A few years ago, I remember walking into my usual coffee shop and doing a double take. The same latte I’d been buying for $3.50 was suddenly over $5. (No extra espresso shot included.) That small moment captures what the Consumer Price Index (CPI) really measures: the average change over time in the prices urban consumers pay for a basket of goods and services.
In simple terms, inflation is the rate at which prices rise, and purchasing power is how much your money can actually buy. When CPI climbs, purchasing power falls. In other words, your dollar quietly shrinks. According to the U.S. Bureau of Labor Statistics, CPI is the most widely used gauge of inflation, making it one of the most closely watched macroeconomic indicators.
As a result, high inflation doesn’t just pinch household budgets; it raises costs for businesses and fuels uncertainty across markets. Central banks, therefore, treat controlling inflation as a primary mandate. Persistently high CPI readings often lead to interest rate hikes.
For traders, this is where things get real. Higher rates typically pressure bonds and can rattle growth stocks, which rely on cheaper borrowing. I’ve seen portfolios swing wildly on CPI release mornings—markets can pivot in minutes. That’s the macroeconomic indicators impact in action. Pro tip: reduce position sizes ahead of major CPI announcements to manage volatility risk.
The first time I traded a jobs report, I thought I understood volatility. I was wrong. At 8:30 a.m., screens flashed, spreads widened, and my calm analysis vanished in seconds. That morning taught me why the unemployment rate deserves respect.
The Unemployment Rate: A Direct Pulse on the Labor Market
What it is: The unemployment rate measures the percentage of the labor force that is jobless but actively seeking work. Labor force means people either employed or actively looking. It sounds simple, but it acts like a real-time heartbeat for macroeconomic indicators impact.
When unemployment is low, households feel secure. They spend more on homes, cars, and even streaming subscriptions (yes, Netflix feels recessions too). That spending fuels business revenue and hiring. When unemployment rises quickly, the opposite happens:
- Consumers cut discretionary purchases
- Businesses delay expansion
- Credit risk increases across markets
As a trading signal, surprises matter more than the headline. If the rate comes in lower than expected, traders may price in inflation and possible rate hikes. Higher-than-expected readings often spark recession fears and bets on rate cuts. I’ve learned to watch wage growth closely; rising earnings can pressure central banks even when joblessness ticks up.
Some argue the unemployment rate is outdated because it ignores underemployment. That’s fair. But combined with participation and wage data, it remains a powerful compass. Consistently.
Interest Rates: The Economy’s Accelerator and Brake Pedal
Interest rates are the price of borrowing money. Set by a central bank—like the Federal Reserve—they determine what commercial banks pay to borrow funds, which then shapes what you pay for mortgages, car loans, or business credit.
Think of the benchmark rate as the economy’s gas pedal and brake.
• Lower rates = cheaper loans, more spending, more investment.
• Higher rates = expensive loans, slower spending, cooler inflation.
When rates drop, companies expand and consumers swipe confidently (hello, new kitchen remodel). When rates rise, borrowing slows, helping tame rising prices.
Here’s where confusion creeps in: rates don’t just affect loans. They ripple across stocks, bonds, currencies, and housing because investors constantly price in macroeconomic indicators impact.
In simple terms, changing rates shifts opportunity costs—what you gain or lose by choosing one investment over another. That’s why even small rate moves can send markets into a frenzy (Wall Street doesn’t do subtle).
Seeing the Whole Board
Understanding markets means connecting dots, not chasing headlines. Many investors obsess over single data points, but macroeconomic indicators impact each other in predictable cycles. Strong GDP plus low unemployment often fuels inflation; inflation pressures central banks to hike rates; higher rates cool spending. Pretending these signals act alone is like judging a movie by one scene (even great trailers mislead).
The contrarian take: diversification without interpretation is lazy.
- Read indicators together, not in isolation.
This integrated lens sharpens risk management and investment planning, helping you anticipate shifts instead of reacting late before markets fully reprice assets.
Mastering Market Momentum and Smarter Trading Decisions
You set out to better understand market momentum, trading signals, and how risk management ties everything together. Now you have a clearer framework for evaluating trends, aligning entries with data, and protecting your capital in volatile conditions.
The real challenge isn’t finding information—it’s applying it consistently when macroeconomic indicators impact price action and emotions start driving decisions. Without a structured approach, missed signals and unmanaged risk can quickly erode gains.
The solution is disciplined analysis paired with a rules-based strategy. When you combine momentum insights, sound financial principles, and defined risk parameters, you move from reactive trading to intentional execution.
If you’re serious about improving performance, don’t leave your trades to chance. Get expert-backed insights, actionable trading signal analysis, and proven risk management frameworks designed to help you trade with confidence. Join thousands of traders sharpening their edge—start refining your strategy today.
 Ask Patrickenzy Tuttle how they got into market momentum watch and you'll probably get a longer answer than you expected. The short version: Patrickenzy started doing it, got genuinely hooked, and at some point realized they had accumulated enough hard-won knowledge that it would be a waste not to share it. So they started writing.
What makes Patrickenzy worth reading is that they skips the obvious stuff. Nobody needs another surface-level take on Market Momentum Watch, Risk Management Techniques, Expert Insights. What readers actually want is the nuance — the part that only becomes clear after you've made a few mistakes and figured out why. That's the territory Patrickenzy operates in. The writing is direct, occasionally blunt, and always built around what's actually true rather than what sounds good in an article. They has little patience for filler, which means they's pieces tend to be denser with real information than the average post on the same subject.
Patrickenzy doesn't write to impress anyone. They writes because they has things to say that they genuinely thinks people should hear. That motivation — basic as it sounds — produces something noticeably different from content written for clicks or word count. Readers pick up on it. The comments on Patrickenzy's work tend to reflect that.
Ask Patrickenzy Tuttle how they got into market momentum watch and you'll probably get a longer answer than you expected. The short version: Patrickenzy started doing it, got genuinely hooked, and at some point realized they had accumulated enough hard-won knowledge that it would be a waste not to share it. So they started writing.
What makes Patrickenzy worth reading is that they skips the obvious stuff. Nobody needs another surface-level take on Market Momentum Watch, Risk Management Techniques, Expert Insights. What readers actually want is the nuance — the part that only becomes clear after you've made a few mistakes and figured out why. That's the territory Patrickenzy operates in. The writing is direct, occasionally blunt, and always built around what's actually true rather than what sounds good in an article. They has little patience for filler, which means they's pieces tend to be denser with real information than the average post on the same subject.
Patrickenzy doesn't write to impress anyone. They writes because they has things to say that they genuinely thinks people should hear. That motivation — basic as it sounds — produces something noticeably different from content written for clicks or word count. Readers pick up on it. The comments on Patrickenzy's work tend to reflect that.