

Ever stare at a trading chart and feel completely lost? It’s like a foreign language, right? So many ups and downs, and then the news hits, adding more confusion.
We all struggle with this. It’s tough to pick out what really matters in all that noise. The real problem?
Figuring out what’s a real signal and what’s just a distraction can be overwhelming.
I know, it sounds like a lot. But trust me, it’s not impossible. This article will dive into signal recognition techniques that traders rely on.
These methods are battle-tested and can help you spot genuine opportunities. I’ve spent years sifting through market data, and by the time you’re done here, you’ll understand not just what signals to look for, but why they actually work.
Trading Signals: The Traffic Lights of Trading
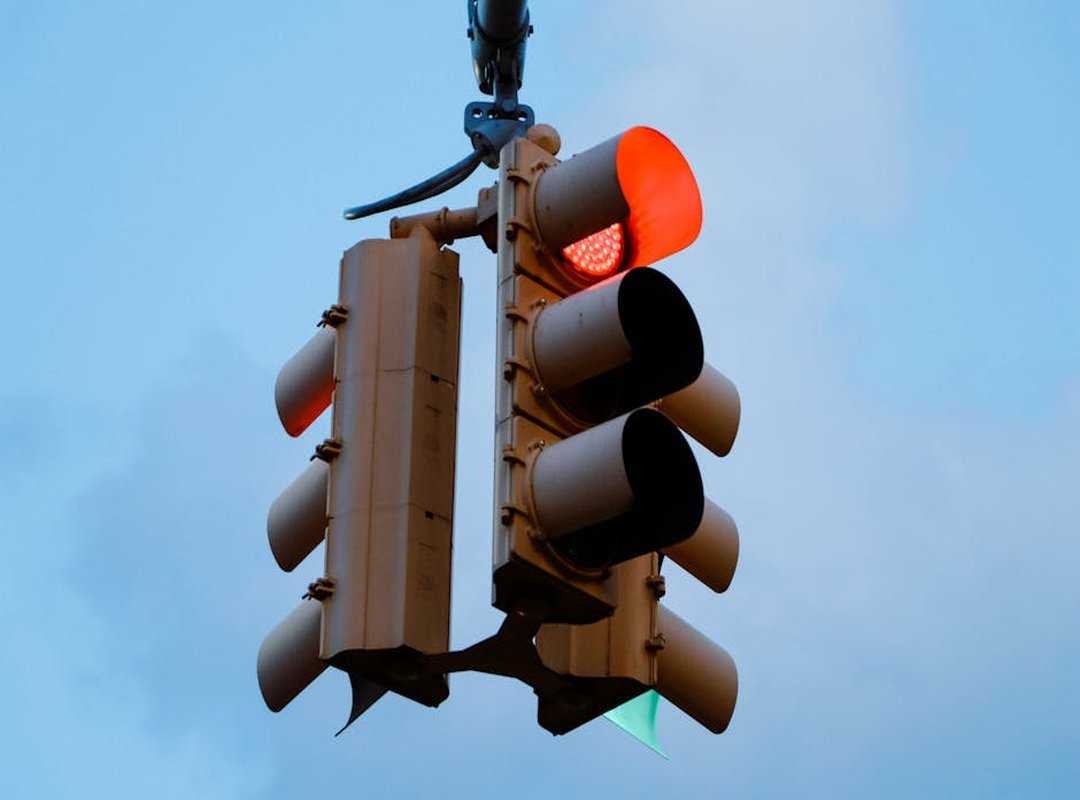
So, what’s a trading signal, really? Think of it as a data-driven trigger for action. It’s like a traffic light for traders.
Green means go (buy), red means stop (sell). Simple, right? These signals cut through the noise, taking emotion and guesswork out of the equation.
That’s what I like. A structured, rules-based approach to trading.
Why are they key? You can get lost in the chaos of market emotions. Trading signals keep you grounded.
They’re not just random alerts (they’re) based on analysis. Without them, you’re gambling blindfolded. It’s about making informed decisions, not wild guesses.
Now, let’s talk about how they’re generated. Basically, two main types of analysis exist. One is technical, looking at chart patterns and indicators.
The other is fundamental, diving into economic data and company health. In this piece, we’ll focus on technical signal detection. It’s where signal recognition techniques shine.
Curious about the tech behind these signals? You can learn more and dive deeper into the world of machine learning trading signals. Got questions?
You’re not alone. Who doesn’t want to trade smarter?
Two Big Strategies: Surf or Snap Back
Let’s break it down. In the world of trading, you’ve got two main camps. There’s trend-following, the “go with the flow” vibe.
And mean-reversion, with its snapping back rubber band theory. Each one is like a philosophy of its own, guiding the signals you should watch.
Trend-following is all about catching the wave. Think of it like surfing. You see a market direction and you try to ride it as far as it goes.
Pretty simple, right? If a stock keeps hitting higher highs and higher lows, or when a price crosses above a long-range moving average, you’re on to something. Those are your signals.
They scream, “Get on board!”
Now, let’s talk about mean-reversion. This one’s for the contrarians. The idea here is that when prices move too far from their average, like an overstretched rubber band, they snap back.
Picture a stock dropping fast on no news. You’re thinking it’s oversold. That’s your hint.
Time to consider buying when everyone else is panicking.
So why does all this matter? Well, recognizing these signals can help you make smarter moves. Knowing when to follow the crowd or act against it is the trick.
I’ve seen both sides play out, and each has its pros and cons. Digging into signal recognition techniques can give you deeper insight into these methods.
Pro tip: Don’t get too attached to just one plan. Markets change, and flexibility can be your best friend. Understanding both approaches can be an edge.
Adapt as you learn and experience more. Keep your eyes open, and your strategies sharper.
Your Toolkit: 4 Popular Signal Detection Methods Explained
Let’s cut to the chase. Signal recognition techniques are everything in trading. You want to know when to buy, sell, or just sit tight.
Traders swear by these methods. Why? Because they work.
Moving Averages (The Trend Spotter)
Ever watched a stock chart and felt dizzy by all that zig-zagging? Moving averages smoothen the chaos. They take price data and iron it out.
Think of it as looking at the weather forecast rather than staring out the window every minute. The “golden cross” (50-day MA crossing above 200-day MA) is huge. When this happens, it’s like your favorite team scoring.
It’s a classic buy signal.
Relative Strength Index – RSI (The Momentum Gauge)
Momentum is like the force in Star Wars. RSI measures how fast prices change. It’s your speedometer for stocks.
Above 70? The stock’s being chased by bulls. Below 30?
Bears are having a field day. These levels signal possible reversals. It’s simple: overbought means sell, oversold means buy.
MACD (The Momentum and Trend Hybrid)
MACD combines momentum and trend. It’s the of indicators (okay, I had to use that cliché once). When the MACD line crosses above its signal line, that’s your green flag.
Go ahead, be bullish. When it flips, consider backing off. It’s a straightforward, no-nonsense approach.
Volume Analysis (The Confirmation Tool)
Volume is fuel for the price move. No volume? No trust.
Think of it like a concert. Is the crowd cheering? That’s a price move on high volume.
Low volume is like applause from a half-empty room. It just doesn’t cut it. You need that confirmation to believe in the move.
Curious about more indicators? There’s a reason traders dive into these metrics. If you’re keen on using oscillators indicators depth, you’re in the right spot.
Let’s face it, tools are only as good as the hands that use them. So get familiar with these methods. They’re not just lines and numbers.
They’re signals guiding you through the market jungle. Feeling lost without them? Understandable.
That’s why they’re a staple in every trader’s toolkit. Use them wisely and watch how your trading game changes.
Trading Tricks: Sidestepping False Alarms
Let’s talk about a real pain in the neck for traders: false signals and getting “whipsawed” by the market. It’s frustrating, right? One moment you’re celebrating a buy signal, and the next, you’re watching it crash and burn.
Enter confluence. This is where you look for multiple, non-correlated signals that point the same way. Say, a buy signal from the MACD backed by high volume and a not-yet-overbought RSI.
It’s like having a team of experts nodding in agreement.
Now, don’t fall into the trap of “Analysis Paralysis.” Using too many indicators at once can fog up your view. Stick to mastering one or two signal recognition techniques first. Less is more here.
The more indicators, the more conflicting noises. Master something simple and get good at it.
And here’s the kicker: no method is foolproof. Seriously, not a single one. You can have all the signals in the world, but that doesn’t mean they’re golden tickets.
Always use those signals as part of a bigger plan that includes risk management. Stop-loss orders are your lifeline. They’re not optional.
Ask yourself: Does any plan guarantee success? Spoiler: No. Trading is about probabilities, not certainties.
The market is a tricky beast, and the sooner you accept that, the better you’ll trade. So, are you ready to ditch the false alarms and start trading smart?
Sharpen Your Market Intuition
We all know the market’s a noisy beast. It’s tough to spot true opportunities when everything blares for attention. But here’s the thing (understanding) signal recognition techniques is your edge.
Forget magic indicators. Master the basics, blend methods, and find confluence. That’s when you trade with confidence.
So, what’s next? Don’t just sit there. Pick a method or two from the article.
Watch them on a chart or in a paper trading account. See them in action. It’s low-risk and high-reward.
Want to cut through the noise? Dive in. Start detecting smarter signals today.
 Trevella Thadriel writes the kind of expert insights content that people actually send to each other. Not because it's flashy or controversial, but because it's the sort of thing where you read it and immediately think of three people who need to see it. Trevella has a talent for identifying the questions that a lot of people have but haven't quite figured out how to articulate yet — and then answering them properly.
They covers a lot of ground: Expert Insights, Risk Management Techniques, Advanced Trading Signal Analysis, and plenty of adjacent territory that doesn't always get treated with the same seriousness. The consistency across all of it is a certain kind of respect for the reader. Trevella doesn't assume people are stupid, and they doesn't assume they know everything either. They writes for someone who is genuinely trying to figure something out — because that's usually who's actually reading. That assumption shapes everything from how they structures an explanation to how much background they includes before getting to the point.
Beyond the practical stuff, there's something in Trevella's writing that reflects a real investment in the subject — not performed enthusiasm, but the kind of sustained interest that produces insight over time. They has been paying attention to expert insights long enough that they notices things a more casual observer would miss. That depth shows up in the work in ways that are hard to fake.